Stop Optimizing the Wrong Metric: Containment, Deflection, and Resolution Are Not the Same
A GZP Reality Check
Teams hit targets and still lose trust when the measure does not match the outcome.
TL;DR
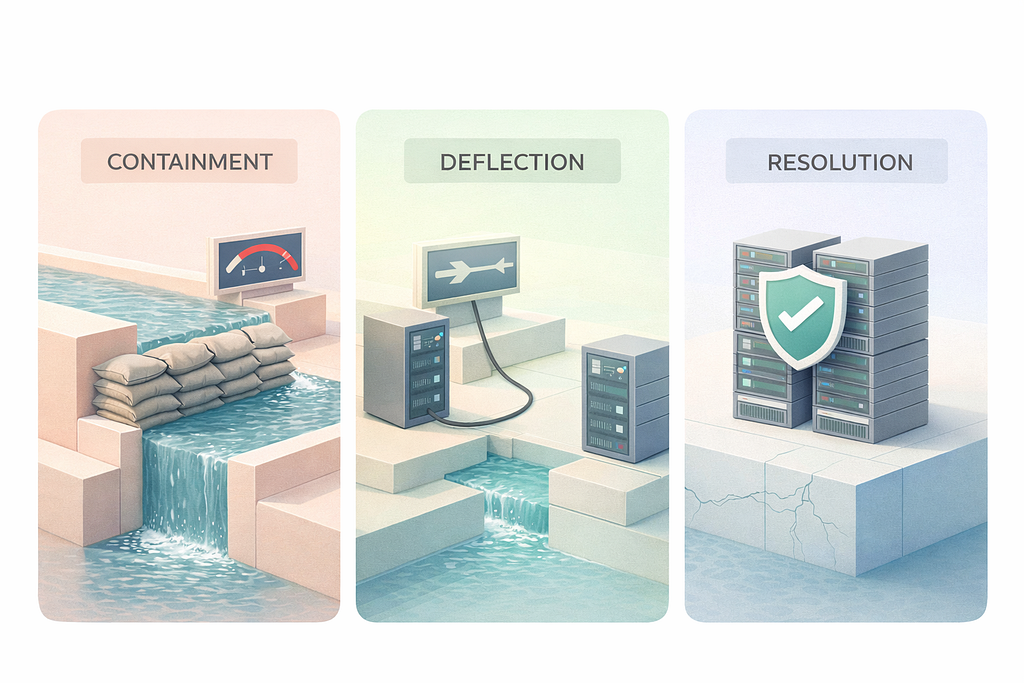
. Containment limits impact fast. It buys time. It does not finish the job.
. Deflection reduces contacts. It can also hide demand if measured poorly.
. Resolution removes the cause. It is slower and costs more upfront, but it pays down repeat work.
The right metric depends on risk, customer impact, and time horizon, not on what is easiest to count.
Use a scorecard, not a single number: speed + repeat demand + quality + safety.
Operations teams rarely fail because people do not work hard. Teams fail when the scoreboard rewards the wrong behavior.
That usually starts in a familiar place. Volume rises. Leaders want fewer tickets, fewer escalations, fewer pages. A target shows up. The target becomes the job. People adapt fast. They should. That is what good operators do.
Then something odd happens. The graph improves and the floor feels worse. Customers sound more irritated. Agents sound more tired. Engineering sees more “not sure, please advise” pings. Managers spend more time arguing about what “fixed” means. The system starts to produce work that looks closed, but is not done.
This is where containment, deflection, and resolution get mixed together.
They are three different outcomes. They help in different moments. They carry different risks. And they need different metrics.
A clean model here makes day-to-day decisions easier. It also makes incentives safer. It stops teams from turning a support target into a trust problem.
Make the three outcomes non-negotiable in plain language
1. Containment is about stopping the bleeding.
It is the temporary barrier put in place to reduce harm while the cause is still alive. It shows up as rate limits, feature flags, manual reviews, rollback plans, “pause shipments,” or a banner that warns users away from a broken path. In customer support, containment is often a safe workaround with clear limits. It is also the decision to hold a case at a higher tier because the situation can get worse if handled casually.
Containment is a win when it prevents spread. It is a loss when it becomes the default end state.
2. Deflection is about reducing contact.
It shifts work away from human queues. That can be good. A good help article can save time for both sides. A good status page can stop panicked contact during an outage. A simple in-product message can prevent confusion. Deflection is also routing. A form that captures the right logs can prevent back-and-forth. A guided flow can keep simple requests out of specialist teams.
Deflection is a win when it removes unnecessary contact while preserving outcomes. It is a loss when it forces customers to do unpaid labor or hides demand.
3. Resolution is about removing the cause.
It is the thing that makes the issue stop happening. It might be a code fix, a policy change, a billing correction, a data repair, a supplier change, or a training update that removes a repeat error. In support, resolution also includes durable case outcomes: money returned, access restored, a charge explained with proof, a device replaced, a record corrected.
Resolution is a win when the same issue stops coming back. It is a loss when it becomes a slogan that blocks throughput and delays relief.
These three outcomes can happen in one journey. Often they should. A major incident needs containment in minutes, deflection in hours, and resolution in days. A simple “how do I” issue may skip containment and go straight to deflection or resolution. A fraud signal might demand containment first, even if it creates friction, because the risk is asymmetric.
The mistake is treating these outcomes as interchangeable. The second mistake is measuring one and assuming it represents the others.
Choose the metric by time horizon, not by pressure
Pressure pushes teams toward the fastest visible metric. That is usually deflection or closure rate. Those measures can be useful, but only if the time horizon is clear.
Containment is a short-horizon goal. It answers: did impact stop growing.
Deflection is a medium-horizon goal. It answers: did contact load reduce without shifting cost to customers.
Resolution is a long-horizon goal. It answers: did the underlying cause get removed and stay removed.
Metrics should map to that horizon. Otherwise the system rewards shortcuts.
A common failure pattern looks like this:
- A queue is overwhelmed. Leadership sets a “tickets per agent” target.
- Agents respond faster, close more, and use macros more often.
- Reopen rates climb. Customers return through other channels. Escalations rise.
- The official ticket metric looks good. The real work moves sideways.
That is not “bad agents.” That is a mismatched scoreboard.
Containment and deflection often show up as a relief valve. They should. The operational goal is to stabilize. But if the only metric is “contacts avoided” or “tickets closed,” the relief valve becomes the strategy.
The longer-term system health needs to be measured too. That means tracking the work that comes back.
Define success with a scorecard, not a single number
A single metric is attractive because it fits in a weekly email. It also creates blind spots.
A practical scorecard keeps teams honest without slowing them down. It ties the three outcomes together, while still allowing tradeoffs during spikes.
A workable scorecard usually has five parts:
1. Speed
- Time to first meaningful response
- Time to containment for incidents
- Time to restore for outages
- Speed matters because silence creates panic and repeat contact.
2. Repeat demand
- Reopen rate within 7 and 30 days
- Repeat contact rate by customer and by issue type
- Issue recurrence rate after a fix ships
- Repeat demand is the best lie detector for fake wins.
3. Quality
- Audit pass rate on a sample of interactions
- Policy compliance rate
- Accuracy rate for categorization and dispositions
- Quality matters because low quality creates hidden future load.
4. Customer effort and experience
- Steps to complete in self-serve flows
- Abandonment rate in help journeys
- Complaint rate, refund requests, chargebacks, or regulator contacts
- This is where deflection can quietly turn into friction.
5. Safety and risk
- Security exception counts
- Fraud loss rate
- Critical incident count by severity
- Safety is where “fast” can become “reckless.”
The scorecard does not need to be heavy. It needs to be stable. It also needs to be hard to game. Repeat demand and audit sampling are the two anchors that stop gaming.
A common question comes up here. Why not just pick resolution and force everything toward it.
Because resolution takes time, and time is not free. Some issues need relief now. Some issues are not worth permanent work. Some issues cannot be resolved until upstream teams act. A scorecard allows triage decisions without letting short-term measures dominate.
Containment metrics that protect trust instead of hiding problems
Containment is the right move when impact is spreading.
The metric cannot be “tickets closed.” That rewards silence. The metric cannot be “time to close,” because containment might require keeping cases open while monitoring.
Containment metrics should measure stabilization. Examples:
- Time to containment: when the spread stopped, not when someone wrote an update.
- Blast radius trend: number of affected customers per hour after the containment step.
- Rollback or mitigation success rate: percent of incidents where containment actually reduced impact.
- Escalation correctness: percent of high-severity cases escalated within the policy window.
Containment needs discipline, or it becomes a holding pattern. Two controls help.
First, every containment action needs an expiry. Not a vague “we will revisit.” A date and owner. The owner can be a team, but a name is better. The expiry forces the conversation about resolution.
Second, containment must be visible. A contained issue that is invisible becomes a quiet backlog of risk. A simple register of open containments, with severity and customer impact, keeps it real. It also stops “temporary” workarounds from turning into permanent product behavior.
Containment is also where comms can get sloppy. A banner that says “some users may be impacted” is not containment. It is a legal hedge. Containment is a control that reduces harm. Comms is support for that control.
Deflection metrics that do not create dark demand
Deflection is easy to measure badly.
The bad version counts fewer contacts and calls it a win. That can create two problems.
First, demand can move to channels that are not counted. People try chat, fail, then email. They try email, fail, then social. They try self-serve, fail, then chargeback. The deflection metric looks great. The real cost goes up.
Second, deflection can push work onto customers. A knowledge base that is hard to search is not help. It is a maze.
Deflection metrics should track completion and outcomes, not just contact reduction. Examples:
- Self-serve completion rate: percent of users who finish the flow.
- Self-serve success rate: percent who do not contact within 7 days after self-serve.
- Deflected journey effort: steps, time, and backtracks in the help path.
- Post-deflection contact mix: whether customers shifted to higher-cost channels.
A clean way to govern deflection is to treat self-serve as a product. That means versioning, measuring, and maintaining it like any other customer-facing surface.
That sounds heavier than it is. A weekly review of the top 20 help topics by traffic and the top 20 by repeat contact is enough. The focus is not on writing more articles. The focus is on removing the gaps that cause repeat contact.
Deflection is also where “AI answers” can be risky in operations terms. The content must be correct, current, and aligned to policy. A wrong answer that sounds confident creates more work later, plus trust damage. That is why sampling audits matter more here than people expect.
A common question shows up here as well. Should deflection be owned by Support or Product.
Ownership can be shared, but accountability needs to be clear. Support often sees the pain first. Product often controls the surfaces that can reduce it. A good model is: Support owns measurement and triage of deflection opportunities, Product owns the in-product changes, and a joint weekly review decides priorities. The key is a single backlog with clear impact estimates, not two parallel lists.
Resolution metrics that do not punish urgency
Resolution is the most valuable outcome, but it is also the easiest to romanticize.
Resolution work competes with roadmap work, incident work, and compliance work. It also competes with daily queue health. If resolution is measured only by “time to resolve,” teams will avoid hard problems. If it is measured only by “root cause completed,” teams may ignore immediate customer pain.
Resolution metrics should prove durability. Examples:
- Recurrence rate: percent of resolved issues that reappear within 30, 60, 90 days.
- Repeat contact reduction: change in contact volume for that issue type after the fix.
- Defect escape rate: whether fixes create new issues.
- Backlog burn-down by severity: whether the oldest high-severity problems are shrinking.
Resolution also needs a boundary. Not every issue deserves engineering time. Not every complaint is a product defect. A resolution program without triage becomes a sinkhole.
A simple triage rule helps:
- Resolve when the issue is high frequency, high impact, high risk, or expensive per contact.
- Contain when the issue is high impact now but unclear cause.
- Deflect when the issue is low risk and stable, and a clear path can be self-served.
This is not a perfect rule. It is a usable one. Teams can refine it by watching repeat demand and cost per contact.
Resolution governance also benefits from “fix acceptance criteria” that are not vague. A fix is not “shipped.” A fix is “repeat contacts dropped by X% and stayed there for Y weeks,” or “error rate dropped below threshold and stayed below,” or “audit failures returned to baseline.”
Without that, resolution becomes a story told in a release note.
Keep teams from gaming the system with three guardrails
Once a metric exists, it will be optimized. That is normal. So the job is to make optimization safe.
Three guardrails work in most orgs.
Guardrail 1: Tie deflection to repeat contact.
No deflection counts as success unless it reduces contacts without increasing repeats or escalations. This can be as simple as a “no contact within 7 days” measure for flows where that is reasonable. For high-stakes topics, widen the window to 30 days.
Guardrail 2: Audit a random sample every week.
Sampling catches both honest mistakes and systematic shortcuts. The sample should include deflected journeys, not only agent responses. The audit should check accuracy, policy compliance, and clarity. A small sample is fine if it is consistent.
Guardrail 3: Track “work moved sideways.”
This is the hidden cost category: social escalations, executive complaints, chargebacks, regulator contacts, and engineering interrupts. If these rise while deflection “improves,” the system is lying. A simple weekly count with trend is enough to start.
Guardrails are not about distrust. They are about system design. Good people will still chase the scoreboard.
Build workflows that let the right outcome happen at the right moment
Metrics are only half the job. The workflow has to make the right behavior easy.
A practical operating model has four layers.
Layer one: Triage that is fast and consistent
Triage should route by risk and impact, not by who yells loudest. Use clear severity rules. Attach required fields. Make it easy to escalate, and make it safe to de-escalate with evidence.
Layer two: Containment playbooks that are pre-approved
Containment should not require a committee in the moment. Pre-approve the common controls: throttles, rollbacks, feature disables, manual review gates. Pre-approve the comms pattern for each severity. The approval happens once, then execution is fast.
Layer three: Deflection surfaces that are owned like a product
Help content needs a lifecycle. Assign owners to the top journeys. Keep change logs. Remove outdated paths. Track broken links. Treat search terms as demand signals, not as noise.
Layer four: Resolution intake that is picky and measurable
Resolution work needs a single backlog with clear acceptance criteria. Tie each item to one of three drivers: frequency, impact, or risk. Set a monthly capacity slice for this work so it is not always “next quarter.”
When these layers are in place, the metrics stop being abstract. They reflect actual choices.
Use examples to prevent category errors
Category errors happen when teams apply the wrong outcome to the wrong problem.
Three examples make the difference concrete.
Example 1: Major outage
During an outage, the first job is containment. Restore service. Reduce impact. Communicate clearly. Deflection supports this by steering customers to a status page and reducing duplicate contacts. Resolution comes later with a post-incident fix and follow-ups.
If the primary metric during the outage is deflection, the team may focus on suppressing contact instead of restoring service. That creates anger and rumor spread. The queue might look calmer while the business burns.
Example 2: Billing dispute
A billing dispute often needs resolution at the case level. The customer needs a clear outcome: refund, proof, correction, or policy-based denial with evidence.
Deflection can help by making invoices easier to read and by showing charges in-product. Containment can help if there is a billing bug by stopping new charges. But if success is measured by “tickets closed,” agents may close with templated explanations that do not address the customer’s facts. Repeat contact rises. Chargebacks rise. The real cost shows up later.
Example 3: Fraud signal
Fraud work starts with containment because loss can grow fast. That may mean friction. It may mean blocking. It may mean manual review. The metric is loss prevented and exposure reduced, not customer happiness in the moment.
Deflection can help by guiding legitimate users through recovery steps. Resolution comes from improving detection logic, fixing false positives, and closing loopholes.
If the fraud team is measured like a standard support queue, they may optimize for speed and closure. That can increase loss.
These examples share one lesson. The “right” outcome is contextual. The metric must match the moment.
Set executive reporting that does not reward shallow wins
Senior leaders want a simple view. That is reasonable. The trick is to keep it simple without making it misleading.
A strong executive view uses three lines, not one:
- Stability: time to containment, high-severity incident count, and service health trend
- Demand: contact volume by top drivers, plus repeat contact trend
- Durability: recurrence rate for the top resolved issues, plus backlog aging for high severity
This keeps containment, deflection, and resolution visible as different tools. It also makes tradeoffs explicit. If stability is poor, containment gets priority. If demand is high and stable, deflection and resolution can be planned. If durability is poor, resolution needs more capacity and better acceptance criteria.
A common pushback is that this looks like “more metrics.” In practice it reduces noise. It stops the weekly debate over why a single number does not match reality.
Keep the language clean so teams stop arguing
A lot of metric trouble is really language trouble.
If “resolved” means “customer got an answer,” then resolution becomes a support closure. If “resolved” means “root cause removed,” then resolution becomes cross-functional work. Both are valid, but they cannot share the same label.
It helps to enforce a small glossary:
- Case resolved: the customer’s case has a documented final outcome.
- Cause resolved: the underlying driver has been removed or reduced with proof.
- Contained: impact stopped growing due to a control.
- Deflected: contact avoided with measured success, not assumed.
This glossary is boring. That is why it works. It reduces debate and makes dashboards readable.
What tends to work when volumes spike
Spikes are where teams abandon good practice. That is also where governance matters most.
Two moves tend to work:
-
Switch the operating mode explicitly.
Declare “containment mode” for specific issue types. Adjust SLAs. Use banners. Centralize comms. Stop pretending it is normal operations. -
Protect a small slice of resolution capacity.
Even during spikes, keep a small group working on the top repeat drivers. Otherwise the system becomes trapped in permanent triage. The slice can be small, but it has to be real.
This approach keeps the machine from degrading. It also prevents morale collapse. People handle stress better when the plan is clear and the tradeoffs are honest.
Optimize for the outcome, then prove it held
Containment, deflection, and resolution are not competing philosophies. They are tools.
The failure is not using one tool. The failure is using one tool for every job, then measuring it like it represents everything.
Containment buys time. It should be fast, visible, and time-bound.
Deflection reduces unnecessary contact. It should be measured by completion and repeat demand, not by fewer tickets alone.
Resolution removes the cause. It should be measured by durability, not by release notes or closure counts.
When the metrics match the moment, teams stop fighting the dashboard. Customers see fewer loops. Leaders see fewer surprises. The operation becomes calmer, even when the work stays hard.
Stop Optimizing the Wrong Metric: Containment, Deflection, and Resolution Are Not the Same was originally published in GZP Blog on Medium, where people are continuing the conversation by highlighting and responding to this story.